|
IntroductionUsing a custom LCR meter system, magnetic samples with known magnetic susceptibility values (from testing done using Bartington and Sapphire Instruments) were placed in the center of the coil to measure the coil's change in inductance. This was done to correlate the change in inductance of the coil-sample system to the magnetic susceptibility of the sample. Experimentation
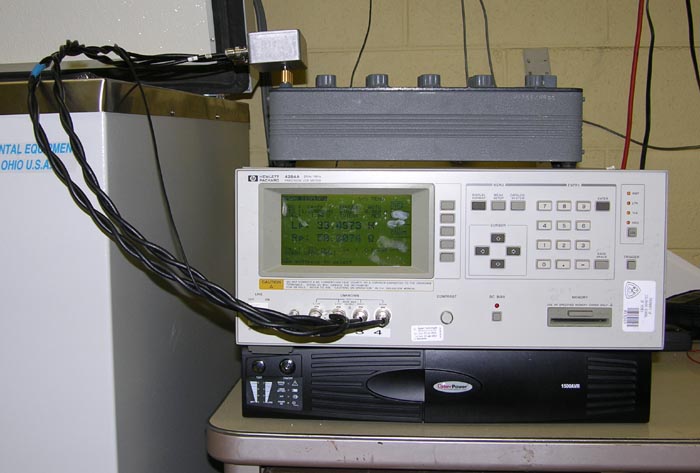
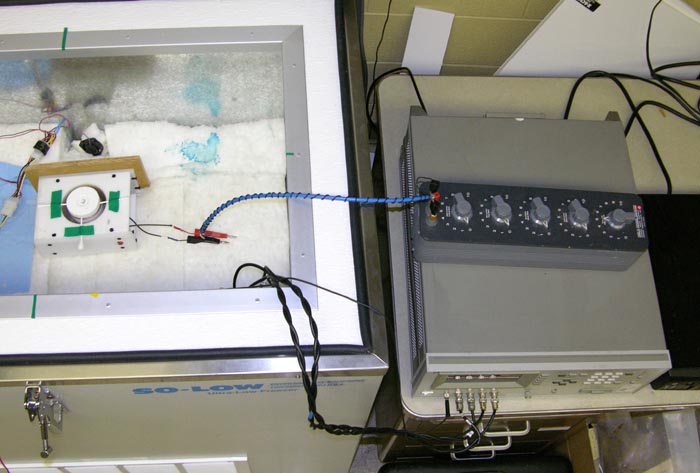
The experimental setup (shown above) consisted of an HP 4284A Precision LCR Meter, a coil, and a decade resistor. The decade resistor (set at 50 ohms) and coil were measured in parallel. Prior to measuring, the cables were calibrated to remove any inductance or resistance added by the cables. This was done by measuring an open and short circuit at the end of the cables. (For a more detailed description of the LCR calibration procedure, see the HP 4284A Precision LCR Meter manual.) After this procedure was completed, the LCR meter was ready to take measurements. First, an intial measurement of the empty coil's inductance and resistance was taken. The sample was then placed in the center of the coil and the measurement was repeated. The sample was then removed from the center of the coil and the empty coil measurement was repeated. Empty coil measurements were taken before and after sample measurements in an effort to account for the random change of inductance within the coil. It was found that the inductance of the coil was very sensitive to temperature. Even the slightest change in room temperature caused the diameter of the coil to vary slightly (a larger diameter when it was warmer and a smaller diameter for colder temperatures), thus changing the inductance.
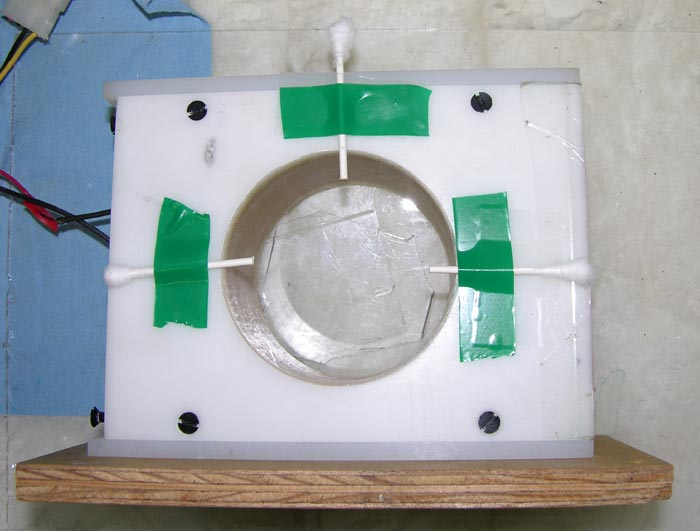
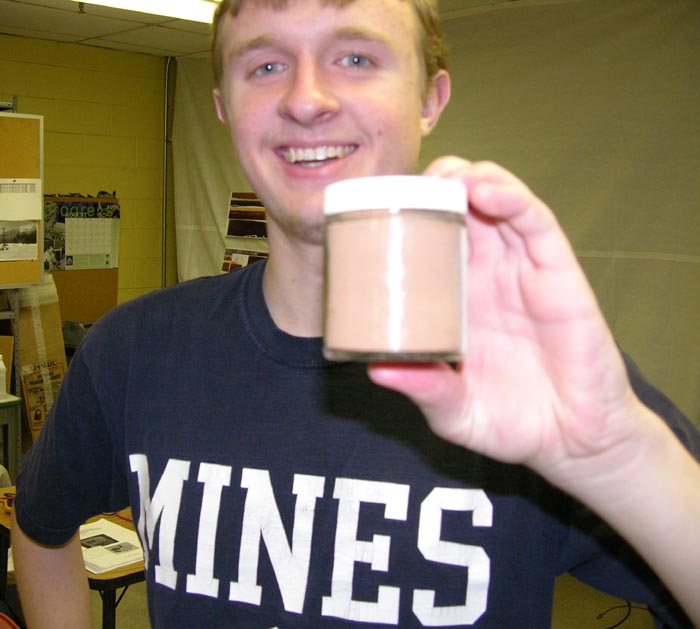
Three Q-tip halves were taped onto the coil to ensure that the sample was be placed in the directly in the horizontal center of the coil (see picture above). Two pieces of Plexiglas were placed under the coil to ensure the sample was directly in the vertical center of the coil. The whole experimental setup was kept as far away from metal as possible to prevent a variation in inductance. The sample measurements used a stack of 256, which was the highest value possible on the LCR meter. To further increase accuracy, each sample’s inductance and resistivity was measured a total of 5 times at each of 4 frequencies and then averaged at each frequency. Each sample was carefully filled as close to the top of the container as possible to ensure the samples were of the same volume (115 cc) and contained the least amount of air (see sample picture below).
ResultsThe resistivity and inductance of 11 different samples were measured and recorded 5 times at 4 different frequencies during the course of the experiment. Average inductance values, standard deviations, and differences between the induction values of air and the induction values of the sample were calculated. Next, each samples change in inductance was divided by its density. This value was then compared to the sample's magnetic susceptiblity found using the Bartington and Sapphire Instruments. The correlation was graphed for each of the 11 samples tested. The equation for the linear relationship is MS=0.0001574*(delta L/density), where MS is the magnetic susceptibility and delta L is the change in inductance. The R2 value was 0.987. A graph of the data is provided on the calibration data page. If a material's change in inductance and density are known, then the magnetic susceptibility can be determined using the equation. ConclusionsThe correlation found between change in inductance divided by density and magnetic susceptibility appears to be the same regardless of frequency. For the purpose of this investigation, it is being assumed that the change in inductance is independent of frequency and temperature. We have begun making inductance measurements versus frequency and temperature to determine their effects on magnetic susceptibility using the correlation determined above.
|
|