|
OverviewGrey hematite possesses a dielectric permittivity relaxation that strongly varies as a function of temperature. This phenomenon could be used in conjunction with GPR to map areas of grey hematite or remotely measure the temperature profile of a grey hematite soil. Thermal modeling was performed to find the temperature versus depth of the Martian subsurface. Viking Thermal ModelThe Viking thermal model was used to constrain the Martian surface temperatures [Kieffer, 1977] [Jakosky, 1981]. Using this data, two sinusoids were determined, one to match the period of a Martian day (sol) and the other to match the period of a Martian year (669 sols). Equation 1 (diurnal variations) and Equation 2 (diurnal and annual variations, hereafter referred to as annual variations) were then used to model the temperature in the ground as a function of depth, z, and time, t for a complete annual cycle [Carlsaw and Jaeger, 1954]. The maximum and minimum temperatures were found as a function of depth to determine the hot and cold soil temperature envelopes at latitudes of 35oN, 0o, and 35oS. Since little is known about the density profile of Mars, a density profile based on Apollo 15 lunar cores was assumed, Equation 3 [Mitchell et al., 1972].
where:
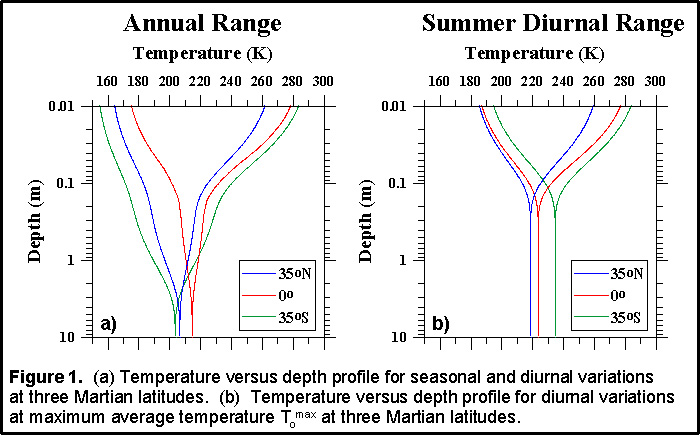
The three temperature parameters (To, Ta, Td) of Equation 1 and Equation 2 are latitude dependent. The values for these parameters were found by using the Viking thermal model [Jakosky, 1981]. Equation 1 and Equation 2 assume that Martian temperatures vary as a sinusoid, but in reality, and in the Viking thermal model, they do not. To accommodate this assumption, the Ta and Td parameters were both separated into minimum and maximum values, see Table 1 and Table 2. When calculating the cold temperature envelope, Tamin and Tdmin values were used. Conversely, Tamax and Tdmax were used to calculate the hot temperature envelope. This method produced diurnal variation temperature envelopes that closely matched Kieffer’s 1977 temperature envelopes using the Viking thermal model. Figure 1 shows the two calculated envelopes at three different latitudes. Latitude 0o was chosen because it contains the largest concentration of grey hematite at the Martian surface. Latitude 35oN was chosen because of the geologic evidence of an ancient ocean basin. Latitude 35oS was chosen because it is the location where the temperature varies the most over an annual cycle. Table 1 - Diurnal parameter values used in Equation 1. The difference between Tomax and Tomin are Tomax occurs during the summer while Tomin occurs during the winter.
Table 2 - Diurnal and annual temperature parameter values used in Equation 11.
 |
|