|
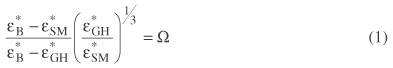
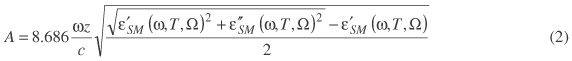
OverviewAt Sinus Meridiani (Latitude 5oN – 6oS), the concentration of grey hematite in the lag deposits ranges from 5-15%, with the remaining composition composed of basaltic sediments [Christensen, 2001]. To simulate this material, grey hematite was mixed with different amounts of Pu’u Nene horizon D. The mixing was governed by the Bruggeman, Hanai, Sen (BHS) mixing equation to find the resulting complex relative dielectric permittivity of the combination, Equation 1 [Sen, et al., 1981]. Once the mixed complex dielectric permittivity was found, it was then converted into radar loss using Equation 2 which assumes a relative magnetic permeability of vacuum.
where:
where:
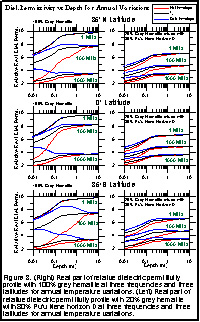
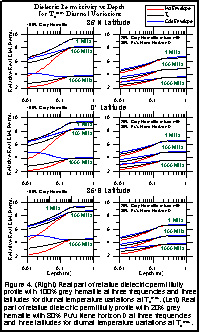
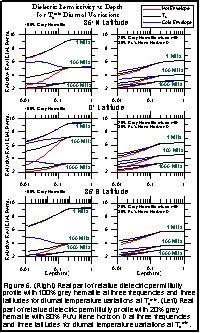
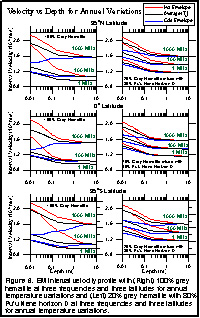
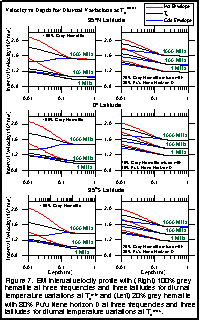
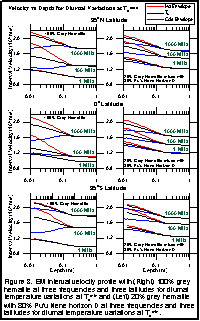
Figure 1 (annual) and Figure 2 (diurnal) show the difference in two-way loss versus temperature and frequency for different mixture percents of grey hematite and Pu’u Nene horizon D at three Martian latitudes. The reason for the cusp in the loss difference curves is because one envelope hot or cold does not always attenuate more than the other. This changes as a function of grey hematite percentage because the losses of the Pu’u Nene horizon D change the frequency at which the losses from both temperature envelopes are equal. 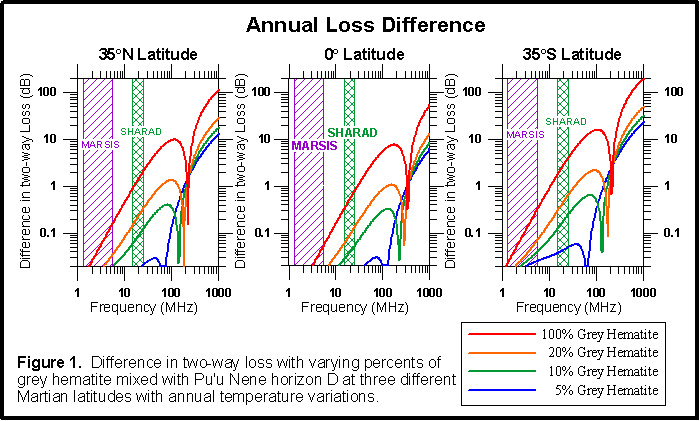 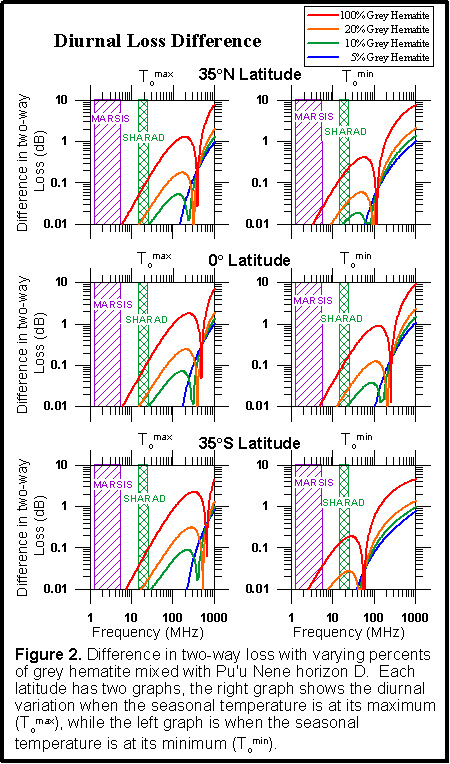 Figure 3 (annual), Figure 4 and Figure 5 (diurnal) show the real part of the relative dielectric permittivity profile at three frequencies and three latitudes at 100% and 20% grey hematite. The dielectric relaxation at the average temperature, To, causes the downward shift at increasing frequency, while increasing density causes the sharp increase in dielectric permittivity. Figure 6 (annual) and Figure 7 and Figure 8 (diurnal) show the EM interval velocity at three frequencies and three latitudes at 100% and 20% grey hematite.
|